Sell Your
House Fast
House Prices in UB3 
The average house price in UB3 () is £344,000 using HM Land Registry data.
The average property price increased by £8,897 (0.03%) over the last 5 years and increased by £1,779 (0.01%) over the last 12 months.
Over the last year, there were 202 residential property sales – a decrease of 61 transactions (-30.20%) relative to the previous year. The majority of house sales (51) were in the £444,000 - £522,000 range. Then came properties in the £522,000 - £600,000 range, where 38 were sold within this price bracket.
Excluding fall throughs, properties are taking an average of 118 days to sell (from being listed to completion) and the average difference between asking and sold prices is £-15,046 (-3%).
In Aug 2026, there were 57 new estate agency instructions, 44 agreed home sales and 71 property price reductions.
5-Year Average Property Prices in UB3 (Hayes)
0.03%
Property prices in UB3 (Hayes) increased by 0.03% in last 5 years.
Average Property Prices in UB3 (Hayes) Over the Last Year
0.01%
Property prices in UB3 (Hayes) increased by 0.01% in last 12 months.
Property Market Heat Gauge for UB3 (Hayes) - Aug 2026

Our Property Market Heat Gauge looks at how long properties in your postcode district have been on the open market before being changed to sold 'Subject to Contract' ('STC') or 'Under Offer' on Rightmove (the UK's leading property portal).
At 81 to 100 days, the broad evidence suggests a very slow moving market. This can often be due to estate agency over-valuations out of sync with the realities, a notable market slowdown or a combination of both. In such scenarios, vendors may either choose to wait for the market to pick up (which may result in relisting the property at a later date). Those committed to selling will often need to drop the price to a level that will entice genuine homebuyer interest or approach a sell house fast or auction company like Property Solvers.
Please note that this is not an indicator of how quickly property sales are taking to complete (i.e. to go through the whole conveyancing process). This measurement also does not take into account the risk of home sales falling through.
No. of New Instructions Over the Last 12 Months in UB3 (Hayes)
No. of Agreed Home Sales Over the Last 12 Months in UB3 (Hayes)
No. of Properties with Price Reductions in UB3 (Hayes)
Average Annual House Prices in the UB3 (Hayes) Postcode since 1995
Recent Sales in UB3 (Hayes)
| Address | Initial Price | Sold Price | Price Change | First Listed Date | Sold Date | Days to Sell |
|---|---|---|---|---|---|---|
| 38 Fairdale Gardens, Hayes, UB3 3JB | £650,000 | £625,000 | -£25,000 | 21 Jan 2026 | 24 Jul 2026 | 184 Days |
| 19 46 Aqua House, Varcoe Gardens, Hayes, UB3 2FH | £299,950 | £287,000 | -£12,950 | 03 Dec 2025 | 13 Jul 2026 | 222 Days |
| Flat 6, 26 Fulmar House, Albacore Way, Hayes, UB3 2FW | £315,000 | £308,000 | -£7,000 | 02 Feb 2026 | 03 Jul 2026 | 151 Days |
| 112 High Street, Harlington, Hayes, UB3 5AD | £435,000 | £435,000 | £0 | 16 Mar 2026 | 26 Jun 2026 | 102 Days |
| 14 Strathearn Avenue, Hayes, UB3 5HJ | £525,000 | £512,500 | -£12,500 | 30 Jan 2026 | 26 Jun 2026 | 147 Days |
| 1 Parsonage Close, Hayes, UB3 2LZ | £550,000 | £520,000 | -£30,000 | 05 Jan 2026 | 24 Jun 2026 | 170 Days |
| 138 High Street, Harlington, Hayes, UB3 5DW | £540,000 | £540,000 | £0 | 21 Jul 2025 | 12 Jun 2026 | 326 Days |
| 4 Botwell Common Road, Hayes, UB3 1JA | £475,000 | £470,000 | -£5,000 | 08 Dec 2025 | 12 Jun 2026 | 186 Days |
| 42 Wood End Green Road, Hayes, UB3 2SH | £650,000 | £625,000 | -£25,000 | 28 Apr 2026 | 08 Jun 2026 | 41 Days |
| 9 Wesley Road, Hayes, UB3 2DR | £570,000 | £566,000 | -£4,000 | 12 Nov 2025 | 05 Jun 2026 | 205 Days |
| 8 46 Aqua House, Varcoe Gardens, Hayes, UB3 2FH | £230,000 | £222,000 | -£8,000 | 20 Nov 2025 | 29 May 2026 | 190 Days |
| 24 Granville Road, Hayes, UB3 4PL | £550,000 | £542,500 | -£7,500 | 14 Oct 2025 | 27 May 2026 | 225 Days |
| 61 Glamis Crescent, Hayes, UB3 1QB | £555,000 | £550,000 | -£5,000 | 02 Jun 2025 | 26 May 2026 | 358 Days |
| 15 Beechwood Avenue, Hayes, UB3 1JN | £600,000 | £580,000 | -£20,000 | 24 Nov 2025 | 26 May 2026 | 183 Days |
| 51 Gade Close, Hayes, UB3 3PY | £339,950 | £335,000 | -£4,950 | 20 Oct 2025 | 22 May 2026 | 214 Days |
| 203 Botwell Lane, Hayes, UB3 2AN | £575,000 | £550,000 | -£25,000 | 23 Mar 2026 | 22 May 2026 | 60 Days |
| 50 Fairey Avenue, Hayes, UB3 4NZ | £325,000 | £325,000 | £0 | 08 Jan 2026 | 22 May 2026 | 134 Days |
| 109 Abbotswood Way, Hayes, UB3 3PG | £250,000 | £250,000 | £0 | 09 Oct 2025 | 11 May 2026 | 214 Days |
| 128 Abbotswood Way, Hayes, UB3 3PQ | £399,950 | £380,000 | -£19,950 | 21 Nov 2025 | 11 May 2026 | 171 Days |
| 24 Willenhall Drive, Hayes, UB3 2UT | £149,950 | £145,000 | -£4,950 | 07 Nov 2025 | 08 May 2026 | 182 Days |
Most Expensive Streets in UB3 (Hayes)
| Postcode | Street | Area | Average | No. of Sales |
|---|---|---|---|---|
| UB3 5EH | Sipson Lane | Hayes | £620,000 | 3 |
| UB3 4QP | Gordon Crescent | Hayes | £618,333 | 3 |
| UB3 4AH | Oakington Avenue | Hayes | £616,000 | 5 |
| UB3 2GE | Greenfield Place | Hayes | £588,400 | 5 |
| UB3 3LW | Silverdale Gardens | Hayes | £582,666 | 3 |
| UB3 4JJ | Monmouth Road | Hayes | £581,862 | 4 |
| UB3 4JE | Station Road | Hayes | £563,333 | 3 |
| UB3 3AH | Stirling Road | Hayes | £556,874 | 3 |
| UB3 5HJ | Strathearn Avenue | Hayes | £556,833 | 3 |
| UB3 1QA | Glamis Crescent | Hayes | £550,833 | 3 |
Least Expensive Streets in UB3 (Hayes)
| Postcode | Street | Area | Average | No. of Sales |
|---|---|---|---|---|
| UB3 4FW | Catimor House, Cranton Avenue | Hayes | £86,250 | 3 |
| UB3 5NH | Brendon Close | Hayes | £145,375 | 4 |
| UB3 5EP | High Street, Harlington | Hayes | £161,000 | 4 |
| UB3 4FQ | Station Road | Hayes | £163,333 | 3 |
| UB3 2LP | Chartwell Court, Church Road | Hayes | £165,833 | 3 |
| UB3 2UX | Willenhall Drive | Hayes | £168,000 | 3 |
| UB3 5JD | Windsor Park Road | Hayes | £199,000 | 5 |
| UB3 4FP | Station Road | Hayes | £201,000 | 3 |
| UB3 5AF | Caroline Place | Hayes | £205,408 | 6 |
| UB3 4BN | Copthorne Mews | Hayes | £210,333 | 6 |
Explore UB3 (Hayes) using map


Selling?
Get Your FREE
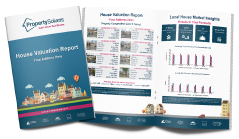
House Valuation Report