

What's Included?
-

Summary Information
Breakdown of the last recorded sales price, estimated current open market value, equity level, price per m2/ ft2), Energy Performance Certificate rating.
-

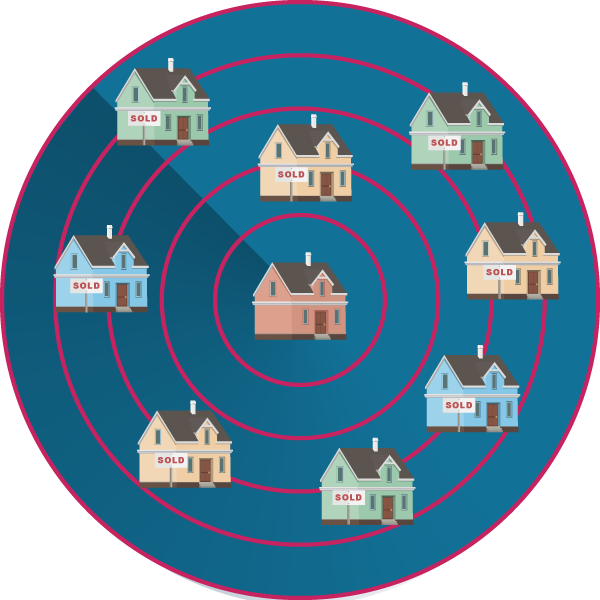
Comparable House Sale Data
Comparable properties within 1/4 a mile using HM Land Registry / Office of National Statistics (ONS) price paid price data.
-

Local House Market Insights
Exclusive data on asking vs. sold house prices as well as how fast properties are selling in any part of England and Wales.
-

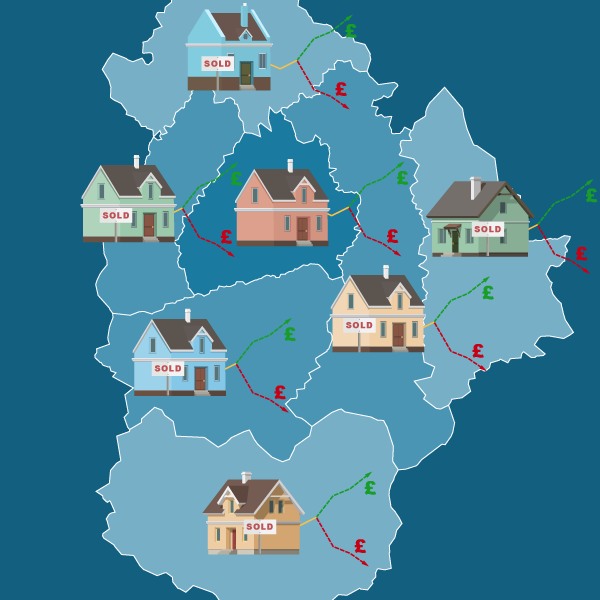
House Price Trends
House price trends at a county/regional level (i.e. yours and surrounding postcodes grouped together).
-

House Prices in Your Postcode
Average prices of all residential properties sold over the most recently-tracked 12 month period in your postcode.
-

Property Types in Your Area
Proportional split of different types of residential properties in your postcode (detached, semi-detached, terraced houses and flats).
-

Sold Prices of Property Types
Sold prices flats, detached, semi-detached and terraced properties in your postcode over the last quarter.
-

House Price Bracket
The percentage of sales within various price brackets of your property type over the last 12 months in your postcode.
-

Prices of Properties Similar to Yours
The average prices of properties of your type with the same number of bedrooms over the last 12 months in your postcode.
-

Freehold / Leasehold Property Prices
Sales profiles of property sales of your tenure (freehold / leasehold) over the last 12 months.
-

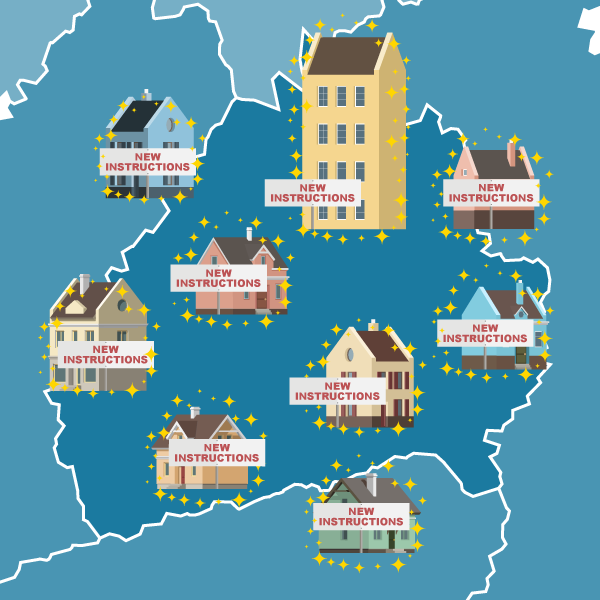
New Property Instructions in Your Local Market
These are the properties that have estate agents have listed for sale in your local area (this does not mean that the properties are sold).
-

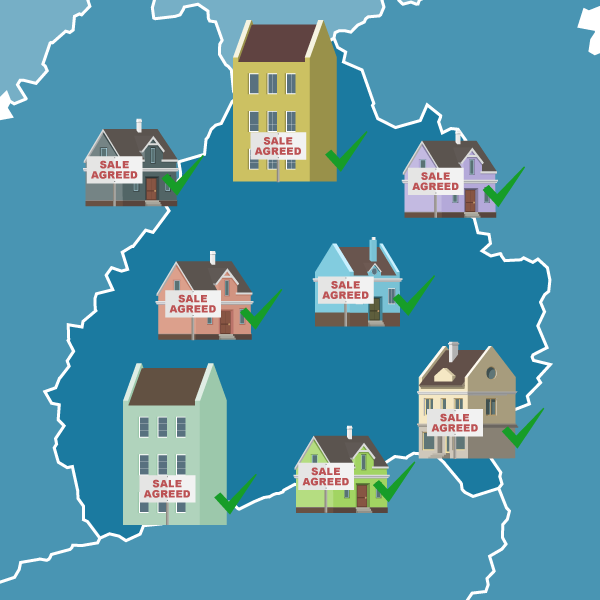
Number of Agreed Home Sales Over the Last 12 Months
Data showing sales agreed by local estate agents (changed to Under Offer or Sold STC).
-

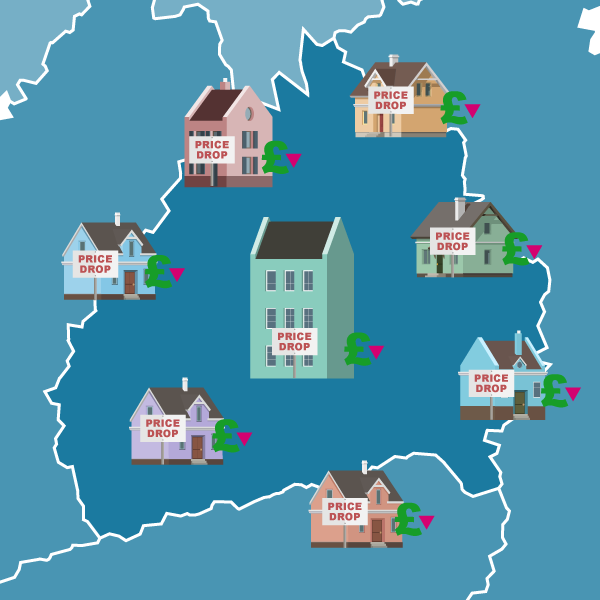
Number of Properties That Have Had Their Prices Dropped
A good sign of the buoyancy of your local house market, the lesser the number of price reductions is typically a positive sign.
-

Table of Recent Sales Close to You
A whole page showing some of the recent sales in your postcode – including differences between initial (asking) price and sold prices as well as the number of days to sell.
-

Most and Least Expensive Streets
The most and least expensive streets in your postcode over the last 5 years – including the approximate distance from your street.


