


Click on the tool below:

")


Rightmove House Valuation
We’ve put Rightmove at the top of the list as it remains the UK’s most popular property portal and an excellent way to check your home’s valuation.
Chances are that you’re pretty familiar with it. If not, don’t worry, it’s very easy to use!
Rightmove Sold Prices
First off, we would suggest using the link below to search sold house prices in your local area:

Note that a wider range of information is shown on a desktop PC or tablet (as opposed to your mobile device).
Enter the postcode and you’ll see sold property prices registered at HM Land Registry.
You can also expand your search for up to 15 miles as well as filter specific timeframes, type and tenure (freehold/leasehold).
Remember there is typically a two-month time delay for Land Registry prices to appear in the public domain. Flats and other leasehold properties often take longer.
As you scroll down, you can sometimes also see useful links to the original listing (with photos, floor plans etc.). You can click on the bold / blue address or directly on the photo image. If it’s grey (without the link), that means that no further data is available unfortunately.

On these listings pages, also look out for the Market Trends, the Price Comparison Report, monthly House Price Index and other buyer/seller guides. Provided there have been enough sales, you may be able to see trends on the best time to sell your house in that given postcode.
Note that there may be anomalies where a property’s sold price is lower than others on the street.
It’s worth checking the photos to see its condition (which could explain why it was sold for cheaper).
Other times, the house/flat could have been sold through a property auction, sell house fast service, privately or as part of a portfolio sale (which could all affect the end values in various ways). Remember also, if you’re part-exchanging your house the traded price is likely to be lower too.
Check Property Sizes
Most streets in the UK have different types of properties and it’s not always easy to compare like-for-like.
For example, yours may have a larger garden or had a back and/or upper extension. Other times, the differences can be more subtle.
For example, end of terrace houses are generally bigger than mid-terraced properties. Although they may look similar from the outside, detached and semi-detached houses often vary in size. Similarly, bar purpose-built blocks, it’s often rare to have flats of the same size – particularly in older buildings.
Although it’s hard to put a price on these differences, it’s a good idea to check the size of neighbouring properties using previous Energy Performance Certificates (EPCs):
")
If you’re still unsure, it can be worth paying for a Royal Institute of Chartered Surveyor (RICS) valuation to put your mind at ease (especially if you feel your property has been downvalued).
These reports will also include a professional house valuation (much more accurate than what you’ll get from an estate agent).
Check Out Your Local Property Market
It’s also a good idea to check out what’s up for sale in your neighbourhood.
Head to the Rightmove homepage.
After entering your postcode and clicking ‘For sale’, enter the property criteria (radius, price range, number of bedrooms, property and the date or ‘added to site’).


Remember also to tick: ‘Include Under Offer, Sold STC…’. You will then be able to see which properties have sold or become under offer recently.
SOLD STC (Subject to Contract) does not always mean that the property sale will definitely go through.
Today, it’s estimated that 1 in 3 UK property sales are falling through. It’s therefore possible that the sale may not complete and be relisted for sale.
Also, remember that there is often a difference between the asking price and the actual sold price – usually between 5% and 10%. Check out the asking vs. sold price difference in your area here.
House Valuation – Questions to Ask
When assessing the value of your property, whilst browsing through the portals, it’s worth asking yourself the following questions:
- Is your property priced higher or lower than the rest of your local market?
- How do other properties compare to yours in terms of condition?
- Do prices seem unrealistic? We know it can be hard, but try and put yourself in the shoes of someone looking to buy;
- How long has the property been on the market? The longer the period, the more chance is that it’s over-priced. Realistically priced homes get snapped up quickly;
- Has the price been dropped? Use the Chrome Extensions in the box above to see any corrections and how long ago they happened;
- Is the marketing any good? Sometimes a poor estate agent can slow down a sale;
- Walking around the area do you see a lot of boards that say ‘SOLD’ by the agent?
- Does there seem to be a lot of unsold properties on the market? This is usually a sign of a buyer’s market;
- Could the property be unmortgageable or have an energy performance rating below C (which would potentially affect its value)?
- Is the property marked as Under Offer or Sold STC? If so, the actual agreed sales price may well be different (taking negotiation and other factors into account).
Towards the bottom right of the listing, you can view the historic sales prices and listings (as above).
Zoopla House Valuation
The second most popular property portal in the UK, Zoopla’s house prices page also offers a breakdown of sold values:

After entering the postcode or road (auto-filled), you can access street-level information on property types that have sold, the number of sales, average sold price and a chronological breakdown of recent transactions.


Zoopla has moved their estimated online valuation to their How Much is My Home Worth? tool.
Due to major questions over how precise Zoopla’s data really is, we generally recommend cross-referencing any asking price data you come across with the Land Registry. The same applies for Rightmove and the other portals mentioned in this guide.
Land Registry Valuation (UK HPI)
The Price Paid dataset is arguably becoming one of the most comprehensive tools for research into property sales submitted to HM Land Registry.
It forms the basis of all the tools in this post and is the prime reference used by the Royal Institute of Chartered Surveyors (RICS) for their level 1 to 3 reports and Red Book Valuations.
We believe it’s the most trustworthy index to track real price movements, although the downside is that it can take 2-3 months for data to get updated.
Click on the box below to see sold house prices in your local area since January 1995:

The following screen will appear:


In most cases, you can enter the name of the road and town or the postcode and the data will appear (i.e. you do not need to enter in any other information, uncheck the boxes etc.).
But you may also want to narrow down your search criteria by changing the various adjustments on the first screen above.
The search results will show transaction history, property type, estate type (freehold/leasehold) and whether it’s a new build or not.
It’s also worth bearing in mind that Price Paid Data excludes scenarios where:
- The sale not been lodged with HM Land Registry for whatever reason;
- The property was not sold at its market value (such as auction sales, repossession purchases or through a We Buy Any House company like Property Solvers);
- The property is bought for a discount under the Government’s ‘Right to Buy’ scheme;
- A share of a property is sold or transferred;
- The property is gifted (by a relative, for example).
Note that HM Land Registry data does not also include the costs of selling a house.
Net House Prices Valuation
Established since 2003, Net House Prices is another simple way to see local prices.

Clicking on the link above and you’ll land on the SOLD prices page. Enter in the postcode and the following data will be displayed:


We would advise avoiding the ‘free valuation’ tools that appear across this website. They are often linked to estate agents and not solid data sources.
Mouseprice Valuation
Operating since 2004, you can also check sold house prices and other useful information using this website.

Upon entering the postcode on the homepage, scroll down a little you’ll see a list of properties on the street in numerical order.


You’ll then be able to see the prices paid and the corresponding date of sale (as per the HM Land Registry).
Where available, click on Expand price history ⇵ besides each property listing to see previous sold prices (going back decades in some cases).
To the right of the desktop version (scroll down on the mobile version), you’ll see some information on average prices. However, we would generally ignore this data as these figures do not take into account different types of property sales. Generally, for example, flats cannot be valued in the same way as houses (but these are averaged together).
There’s also a graph showing how many home sales there are in the specific postcode over the previous 6 years.
Property Price Advice Valuation
Running since 2005, Property Price Advice states that it is the ‘go-to source for free, impartial UK property price information and advice.’

Enter the postcode and click on the second button in the middle of the page: ‘Sold House Prices’ (with the white background).


A list of properties will appear with the last sale date, type and tenure (freehold/leasehold).
Use the drop-down menus to select the distance (up to 1 mile), date of sale (up to 10 years), house type (house, bungalow, townhouse, flat or studio) and tenure to access Land Registry-linked historical data.
Our Property Valuation
Requiring registration, Our Property has an interesting ‘survey’ feature where you can find some useful information.

Once you have registered, enter the postcode and a list of nearby street addresses will appear:


Although not always available or fully complete, by clicking on Surveys, you can see some key characteristics of the property once you then click on ‘View full survey’ (on the next screen):


However, please note the disclaimer on the website that: “Our Property has not validated this information for accuracy or completeness.”
Click on the blue number in the third column to see the sales information:


Similar to Mouseprice, we would advise ignoring ‘Average’ (in the last column) unless all the properties in your neighbourhood are very similar.
Via the ‘House Price Stats’ (in the top navigation bar) subscribers can get at a glance listings of the most expensive, least expensive and most transient roads (i.e. where the most sales have occurred). Note that this covers a limited number of cities and counties in the UK, but hopefully they will expand out!
The Move Market
An impressive newcomer to the set of house valuation tools, The Move Market primarily uses HM Land Registry data.

Start by entering your postcode into the search bar and you’ll be presented with some key pieces of information on the street, namely:
- Total number of property sales over the last 10 years;
- The most recent property sale (date and price);
- The largest proportion of property types sold.
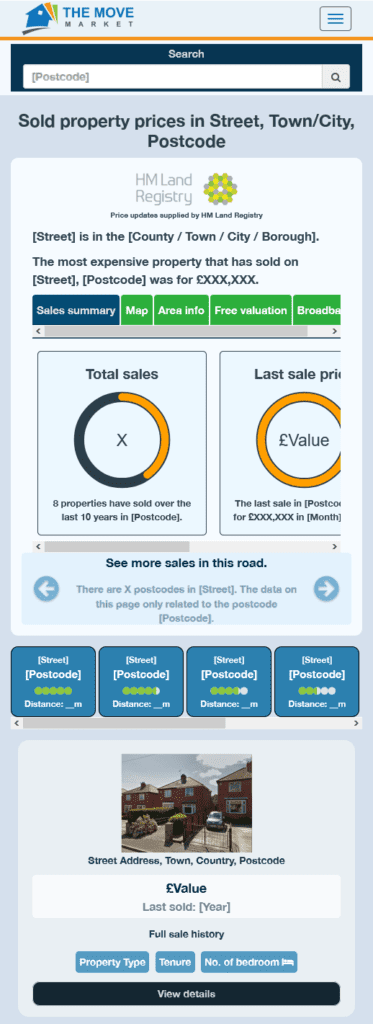
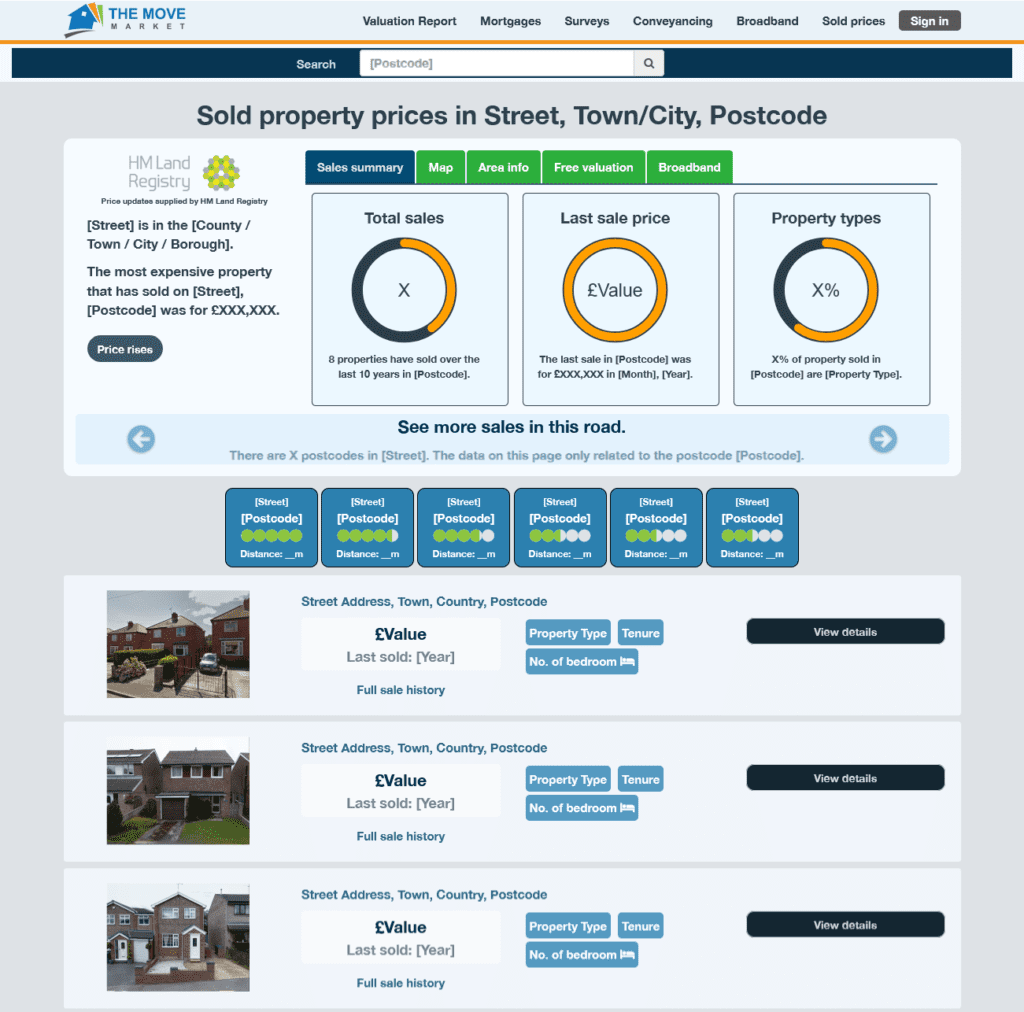
If the property is on a long street with different postcodes, you can scroll left or right to observe the relevant data.
Underneath that, check out the house price trends on neighbouring streets. You can click on the blue boxes to see that data on the street specifically.
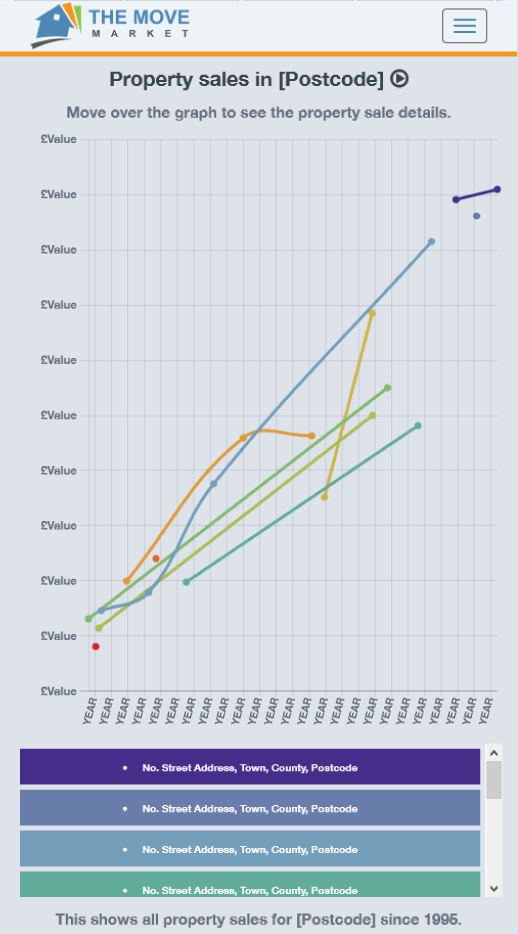
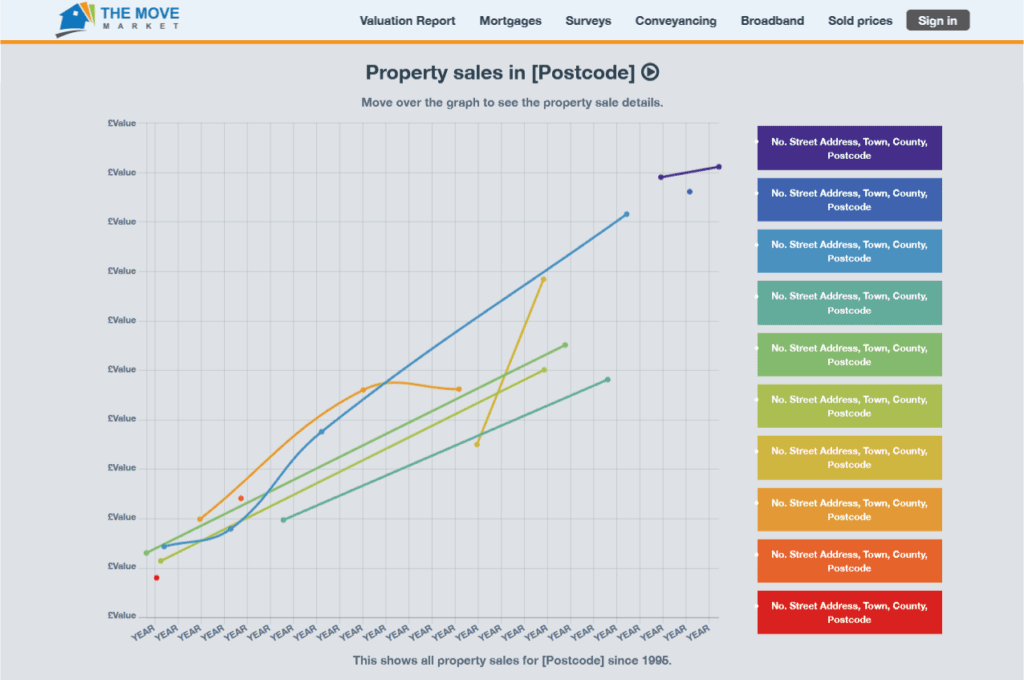
House Price Rises
Click on the ‘Price rises’ and you can see a colour-coded graphical representation of how property prices on your selected street have changed.
Historic House Sales
Below, you can see historical sales (most recent at the top).
For each property, you’ll see information regarding the last sold price (and year), type and tenure (i.e. whether it’s a freehold or leasehold).
Click on ‘Full sale history’ and a pop-up will appear that will show the price(s) and date previous sales of the same property.
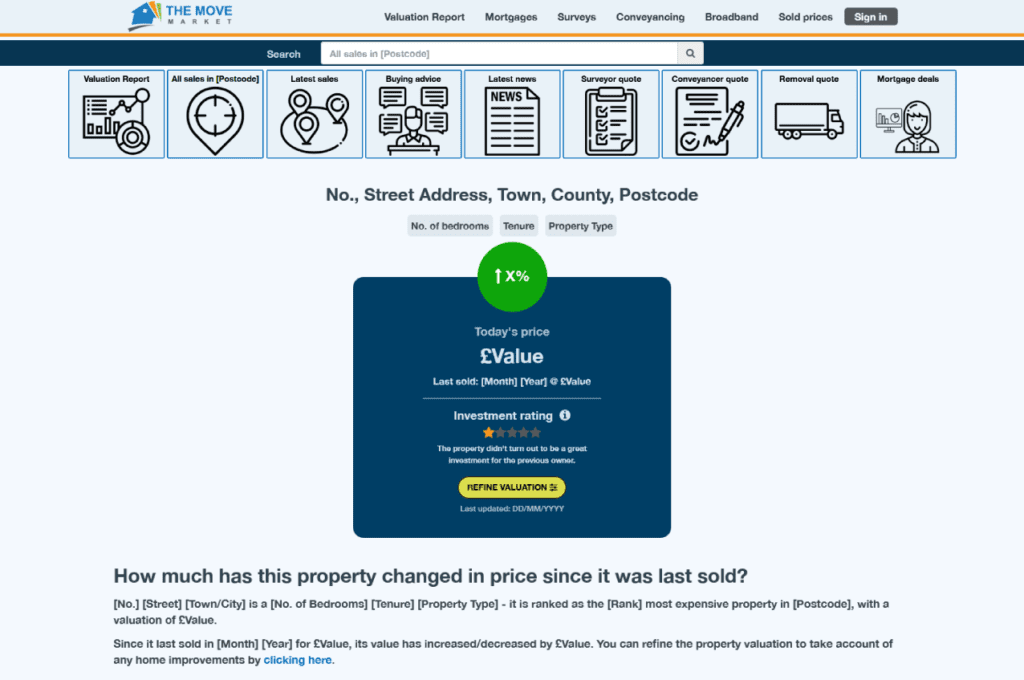
View Property Details
Click on ‘See today’s price’ (in the pop-up) to see an estimation of where The Move Market estimates the price is currently at based on selling the property unmodernised. You can get to the same page by clicking on ‘View details’ on the historical sales list.
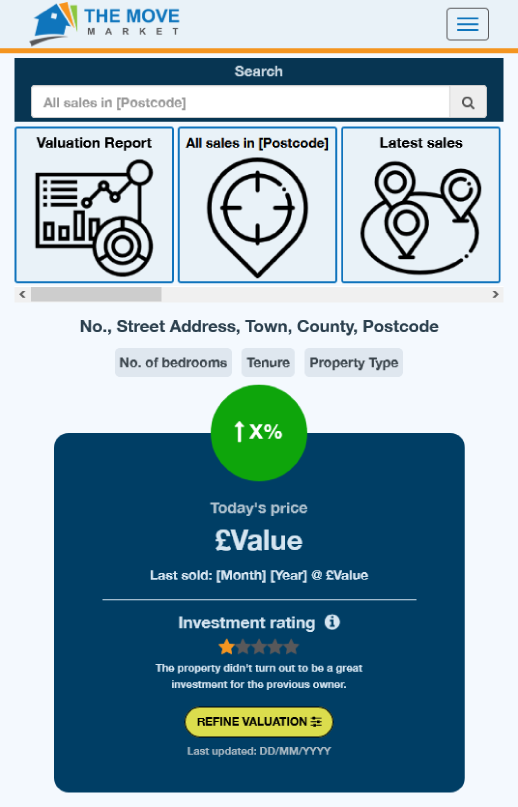
There is also an investment rating given out of 5 stars. Note that you can also access this by clicking on ‘View details’ on the main search page.
Also, there the option to ‘refine valuation’ where you can scroll down and see how much extra you will achieve if you were to make improvements to the boiler, bathroom, kitchen, flooring, windows and doors (by heading to the ‘Internal improvements’ tab).
The Major renovations provides another sliding scale showing the extra house price value created by adding a single-storey extension, one/two bedroom extension, new outbuilding and garden improvements.
Back on the Property Details page, you can also see the following:
- How much has the property changed in price since it was last sold;
- What are the people like that live there (age, health, work/employment, background/culture/religion, property ownership/rental/social housing);
- How this property compares to others in the postcode (with a property price rank, more sales history information and property investment performance);
- How often does property become available on the street;
- Cost per square foot;
- Property valuation details (more information on house price growth and housing costs);
- Other housing-related facts/costs/expenses (further property details, stamp duty / mortgage costs, added value by extending, similar priced property, recent sales);
- Price summary.
A Word of Caution…
As with Zoopla’s and Net House Prices’ estimations, we would suggest taking these extra details with a pinch of salt.
Take the ‘Investment rating’ for example. There’s no way of knowing whether the property is/was rented to make such a determination, let alone what the rent would be (there is no cohesive index of rents in the UK).
The index also has no way of tracking the condition of the property, the cost of internal improvements or major renovation works as well as knowing how much value is added will be created.
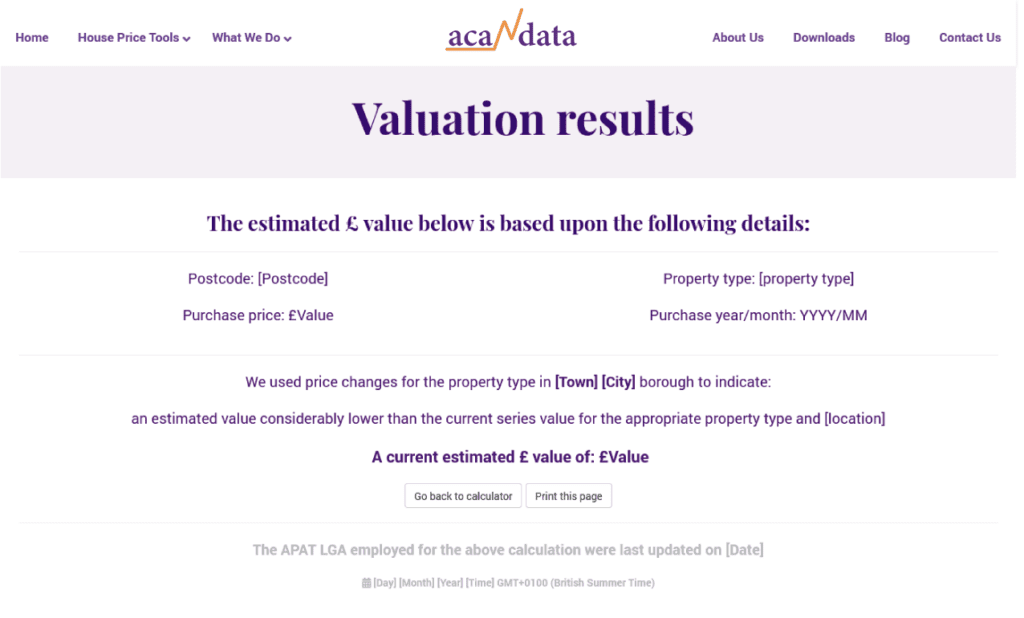
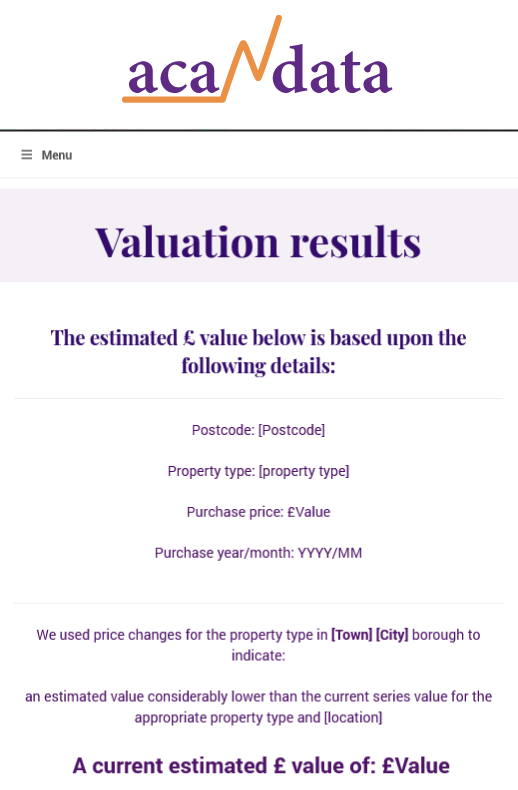
Acadata House Prices
Acadata is an independent house valuation research consultancy.
They’re regularly featured in the mainstream media and are known for taking an academic approach to their assessments of house price trends.

The house price calculator shows the change in value taking into account their measurement of house price inflation, applying county or London borough level HM Land Registry data.
The simple form requires you to enter the following details.
- The property type (i.e. whether it’s a flat or terraced / semi-detached / detached house);
- The original purchase price;
- The purchase year and month;
- The full postcode.
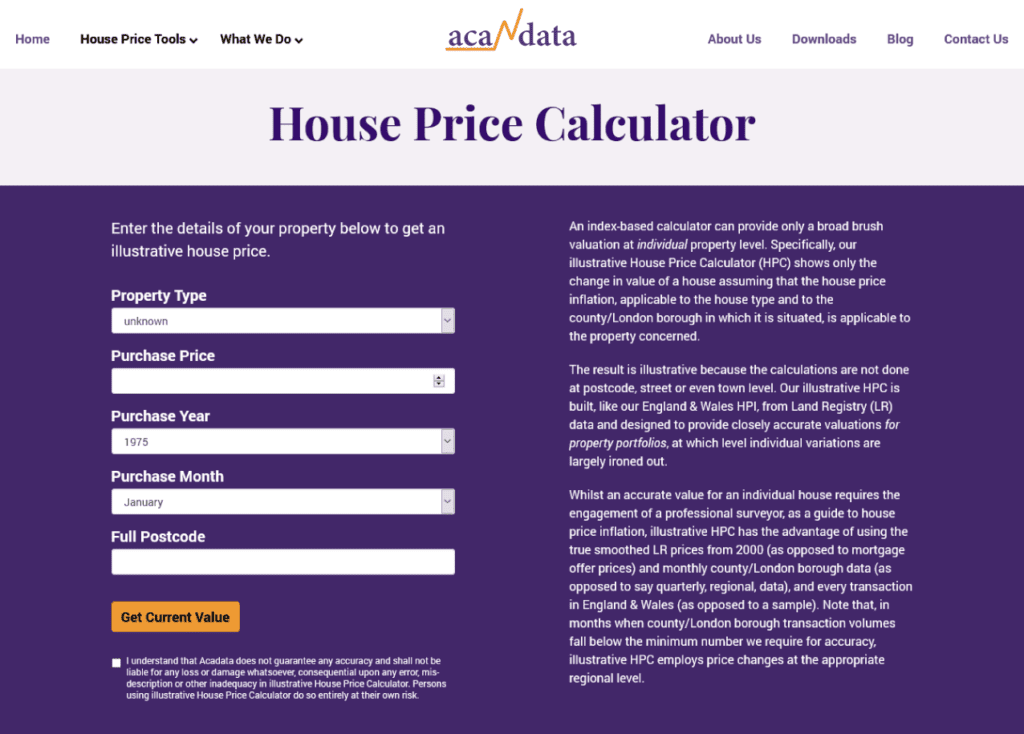
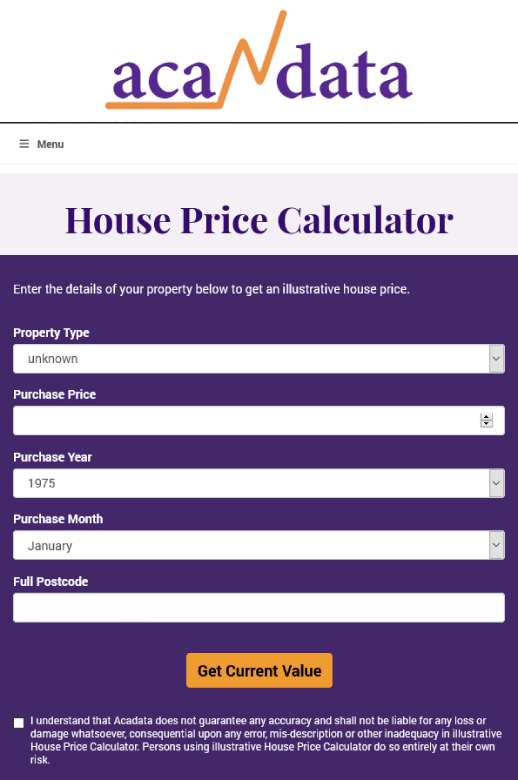
Once you’ve entered these details, you’ll need to click ‘Get Current Value’ and agree to the terms and conditions. An estimated value will then be presented.
If you’re checking out other properties price movements, you can use the tools described above to obtain the necessary data.
Property Data
Although not strictly free (although you can take out a 14-day trial), Property Data’s subscription service is well worth investing in if you’re looking for a deep dive into macro and micro trends.

The platform has increased in popularity amongst professional property buyers and developers. Indeed, for land transactions and other more specific calculations related to overages, for instance, this tool provides an extra level of detail relative to the tools described above.
Property Data is split into 3 principal sections, namely: Research, Source and Evaluate.
For the purposes of this blog post, below is a list of some of the most relevant features available;
- Pricing – complete asking and sold price data, segmented by £/sqft or number of bedrooms;
- Rents and Yields – long let and HMO rental data, with accurate yields calculated by the number of bedrooms;
- Strongest Yield in the UK – using live market data;
- House Price Growth – five years of historical capital growth data calculated specifically for the defined local area;
- Activity and Demand – transactions per month, turnover rate and a demand score for both the sales and rental markets;
- Housing Stock – analytics on the physical property stock, occupancy characteristics and estate agent league tables;
- Demographics – hyper-local data on deprivation, health and education levels, as well as work, commuting, age and political affinities;
- Planning – everything in one place: our data has 99%+ coverage of all planning applications UK-wide;
- Crime – analytics on crime rates and types of crime reported to police in your defined local area;
- Schools – primary and state schools with rankings, size and key details, plus local independent schools;
- Postcode Data – key property investment statistics by postcode district;
- Charts – house prices and market / economic health;
- Plot Map – high-resolution mapping feature showing buildings, boundaries, ownership status, planning and more;
- Valuation – an instant valuation of any urban or suburban UK property;
- Comparable – find sold comparables of local properties.
Sample Property Data Report
Click on the image below to view:
Although not an exclusively free tool, Property Data’s price points are reasonable with various options based on usage. They also offer a free 14-day trial.
Boomin House Valuation
Brought to the property valuation space by the home buyer and seller “matchmaking” portal, Boomin’s SmartVal Online House Valuation Tool uses estate agency estimations to deliver its results.

Available 24/7, after entering your details and answering a series of questions about the property itself, you’ll be asked to register and verify your mobile phone number.
You can then select up to 3 online estate agents to provide valuations within a few minutes. If there are no agents available at the time of the request, the offline (traditional) agents you select will forward their estimates by the next business day at the latest.
Note that you can request up to 3 SmartVals for the same property in any 3-month period.
Again, as with most online/offline house valuation tools, please be sure to cross-reference the estimates against HM Land Registry data.


")

