Sell Your
House Fast
Gowerton House Prices 
The average house price in Gowerton is £165,666 using HM Land Registry data.
The average property price increased by £40,889 (20.39%) over the last 5 years and increased by £8,175 (3.51%) over the last 12 months.
Over the last year, there were 72 residential property sales – a decrease of 22 transactions (-30.56%) relative to the previous year. The majority of house sales (20) were in the £140,000 - £188,000 range. Then came properties in the £188,000 - £236,000 range, where 14 were sold within this price bracket.
Excluding fall throughs, properties are taking an average of 43 days to sell (from being listed to completion) and the average difference between asking and sold prices is £-9,884 (-4%).
In Aug 2026, there were 8 new estate agency instructions, 7 agreed home sales and 5 property price reductions.
5-Year Average Property Prices in Gowerton
20.39%
Property prices in Gowerton increased by 20.39% in last 5 years.
Average Property Prices in Gowerton Over the Last Year
3.51%
Property prices in Gowerton increased by 3.51% in last 12 months.
Property Market Heat Gauge for Gowerton - Aug 2026

Our Property Market Heat Gauge looks at how long properties in your postcode district have been on the open market before being changed to sold 'Subject to Contract' ('STC') or 'Under Offer' on Rightmove (the UK's leading property portal).
At 41 to 60 days, the broad evidence suggests that the market is reasonably slow moving. Although some sellers in your postcode may be willing to wait up to 9 weeks, this data would suggest that estate agents may be overvaluing properties. In such scenarios, some vendors may either choose to wait for the market to pick up (which may result in relisting the property at a later date).Others simply reduce the price to a level that will entice more buyer interest or approach a sell house fast or auction company like Property Solvers.
Please note that this is not an indicator of how quickly property sales are taking to complete (i.e. to go through the whole conveyancing process). This measurement also does not take into account the risk of home sales falling through.
No. of New Instructions Over the Last 12 Months in Gowerton
No. of Agreed Home Sales Over the Last 12 Months in Gowerton
No. of Properties with Price Reductions in Gowerton
Average Annual House Prices in the Gowerton since 1995
Recent Property Sales in Gowerton
| Address | Initial Price | Sold Price | Price Change | First Listed Date | Sold Date | Days to Sell |
|---|---|---|---|---|---|---|
| 6 Mill Street, Gowerton, Swansea, SA4 3ED | £180,000 | £172,000 | -£8,000 | 26 Jan 2026 | 01 Jul 2026 | 156 Days |
| 15 Fairwood Terrace, Gowerton, Swansea, SA4 3AE | £239,995 | £222,000 | -£17,995 | 09 Sep 2025 | 11 Jun 2026 | 275 Days |
| 155 Gorwydd Road, Gowerton, Swansea, SA4 3AN | £230,000 | £215,000 | -£15,000 | 11 Oct 2025 | 27 May 2026 | 228 Days |
| 103 Cecil Road, Gowerton, Swansea, SA4 3DN | £300,000 | £300,000 | £0 | 09 Jan 2026 | 27 May 2026 | 138 Days |
| 36 Hillbrook Close, Waunarlwydd, Swansea, SA5 4QD | £250,000 | £245,000 | -£5,000 | 28 Feb 2026 | 19 May 2026 | 80 Days |
| 43 Clos Helyg, Gowerton, Swansea, SA4 3GH | £325,000 | £315,000 | -£10,000 | 20 Nov 2025 | 30 Apr 2026 | 161 Days |
| 18 Talbot Street, Gowerton, Swansea, SA4 3DB | £375,000 | £355,000 | -£20,000 | 17 Oct 2025 | 13 Apr 2026 | 178 Days |
| 16 Login Road, Waunarlwydd, Swansea, SA5 4TH | £170,000 | £165,000 | -£5,000 | 22 Oct 2025 | 02 Apr 2026 | 162 Days |
| 11 Ffordd Y Gamlas, Gowerton, Swansea, SA4 3DT | £270,000 | £260,000 | -£10,000 | 07 Aug 2025 | 27 Feb 2026 | 204 Days |
| 6 Nevills Close, Gowerton, Swansea, SA4 3BG | £275,000 | £270,000 | -£5,000 | 31 Aug 2025 | 11 Feb 2026 | 164 Days |
| 126 Brithwen Road, Waunarlwydd, Swansea, SA5 4QX | £230,000 | £210,000 | -£20,000 | 04 Apr 2025 | 06 Feb 2026 | 308 Days |
| 124 Brithwen Road, Waunarlwydd, Swansea, SA5 4QX | £375,000 | £370,000 | -£5,000 | 02 Aug 2025 | 23 Jan 2026 | 174 Days |
| 519 Cwmbach Road, Fforestfach, Swansea, SA5 4TJ | £135,000 | £132,000 | -£3,000 | 28 May 2025 | 27 Nov 2025 | 183 Days |
| 120 Brithwen Road, Waunarlwydd, Swansea, SA5 4QX | £250,000 | £233,000 | -£17,000 | 29 Jan 2025 | 25 Nov 2025 | 300 Days |
| 31 Porth Y Waun, Gowerton, Swansea, SA4 3BJ | £325,000 | £320,000 | -£5,000 | 31 May 2025 | 29 Oct 2025 | 151 Days |
| 288 Swansea Road, Waunarlwydd, Swansea, SA5 4SL | £169,995 | £160,000 | -£9,995 | 27 Mar 2025 | 09 Oct 2025 | 196 Days |
| 7 Sterry Road, Gowerton, Swansea, SA4 3BS | £299,995 | £270,000 | -£29,995 | 28 May 2025 | 30 Sep 2025 | 125 Days |
| 40 Bryn Road, Waunarlwydd, Swansea, SA5 4RA | £399,995 | £395,000 | -£4,995 | 16 Apr 2025 | 25 Sep 2025 | 162 Days |
| 1 Tygwyn Place, Gowerton, Swansea, SA4 3BL | £199,500 | £195,000 | -£4,500 | 16 Nov 2024 | 10 Sep 2025 | 298 Days |
| 32 Hillbrook Close, Waunarlwydd, Swansea, SA5 4QD | £170,000 | £170,000 | £0 | 06 Dec 2024 | 04 Sep 2025 | 272 Days |
Most Expensive Streets in Gowerton
| Postcode | Street | Area | Average | No. of Sales |
|---|---|---|---|---|
| SA4 3FB | Redwood Court | Gowerton | £708,750 | 4 |
| SA4 3HA | The Mount | Gowerton | £520,000 | 5 |
| SA5 4SJ | Westfield Road | Waunarlwydd | £365,000 | 5 |
| SA4 3AU | Bishwell Road | Gowerton | £359,600 | 5 |
| SA4 3DJ | Oakwood Drive | Gowerton | £352,000 | 8 |
| SA4 3DN | Cecil Road | Gowerton | £326,375 | 4 |
| SA4 3AY | Brookside | Gowerton | £316,666 | 3 |
| SA4 3DW | Cecil Road | Gowerton | £314,700 | 5 |
| SA4 3AR | Cedar Close | Gowerton | £305,500 | 3 |
| SA4 3HH | Cae Mansel Road | Gowerton | £287,333 | 3 |
Least Expensive Streets in Gowerton
| Postcode | Street | Area | Average | No. of Sales |
|---|---|---|---|---|
| SA5 4RE | Caer Gynydd Road | Waunarlwydd | £88,166 | 3 |
| SA4 3BZ | Bryn Eithin | Gowerton | £100,200 | 5 |
| SA4 3BY | Cae Grawn | Gowerton | £119,400 | 5 |
| SA5 4TH | Login Road | Waunarlwydd | £121,666 | 3 |
| SA4 3BW | Sterry Road | Gowerton | £122,333 | 3 |
| SA4 3BR | Sterry Road | Gowerton | £129,750 | 5 |
| SA4 3EA | Church Street | Gowerton | £138,100 | 5 |
| SA4 3GG | Clos Leighton Davies | Gowerton | £145,750 | 4 |
| SA5 4TB | Victoria Road | Waunarlwydd | £147,527 | 6 |
| SA5 4TD | Swansea Road | Waunarlwydd | £147,990 | 5 |
Explore Gowerton and Neighbouring Area House Prices


Selling?
Get Your FREE
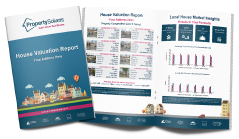
House Valuation Report